Typologie des modèles de prévision des crues/en
 Language: Language: |
Français • English |
Sommaire |
Background information
The European Union Twinning Project for Turkey entitled "Capacity building to implement the Flood Directive” (TR 10 IB EN 01) involves France as "senior partner" and Romania as "junior Partner".
Hydrography of the turkish watersheds
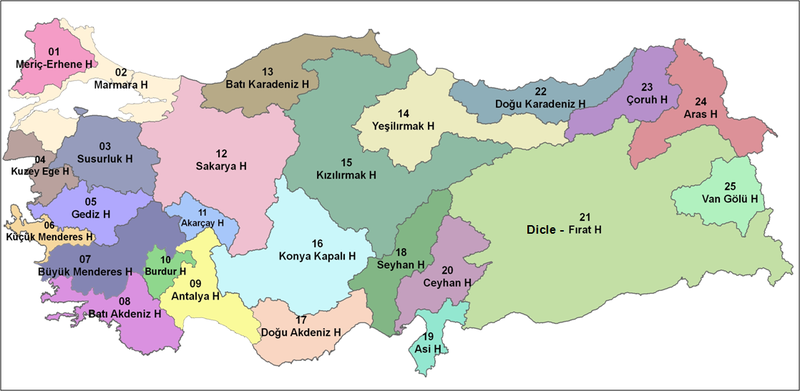
The following chart gives a representation of the 25 hydrographical turkish basins.
One action conducted for the Turkish Water Directorate is to propose a typology of their watersheds, depending on their hydrological characteristics and on their meteorological regime.
To complete this typology and to continue the mission of advisory of the Turkish Water Directorate, a typology of the simulation models is proposed as follow-up.
This table identifies one or more types of models depending on the main process in each watersheds
Using this table as a LEGO® method
The simulation tools identified in the previous table must be used closely in relation with the characteristics of the sub-basins. Let us take a practical example : given a wide hydrological basin as considered in the Water Framework Directive, we would like to equip it with a set of simulation tools. The method to be used is similar as a LEGO® play-game. We will use it by following the process set-up below:
- identify elementary bricks, that is to partition the wide basin in a series of homogeneous hydrological sub-basins
- locate the available meteorological gauging stations on each sub-basin (rain gauging, radar) and if necessary to plan to equip the basin with a sufficient numbers
- locate the outlet of each sub-basin and verify the presence of a functioning hydrometrical gauging station, able to transmit with an appropriate time step data to a central unit
- this work on the upstream basins will give us the opportunity to determine the hydrological component of our system. One should see if these basins could be equipped with rain-discharge models (given access to meteorological gauging station as well as hydrometrical gauging station)
- during the process of sub-basins aggregation, the rain-discharge relation could begin unappropriated because the main process is no more concentration than propagation. A new model should be used to simulate the flood (water level evolution) or better the inundation (plain overflowing)
- one should identify the existing hydrometrical gauging stations in order to use them as the main measurement network to support numerical modeling
- downstream, the topography and the bathymetry are generally better known, which allows us using 1D hydraulic models to simulate inundation. This could be completed by hydrological rain-discharge models
- further downstream, the plain could begin more hydraulically complicated and using more sophisticated models like 1D cell models or 2D models
- at the sea entrance, the interaction between river discharge and sea conditions : storm surge, wave, necessitates the use or 1D or 2D hydraulic models
- The two following examples shows the way to implement this LEGO® method.
Example n°1 : coupling rain-discharge models with discharge-discharge model
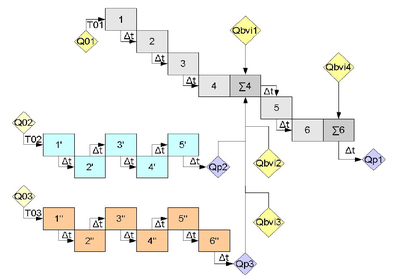
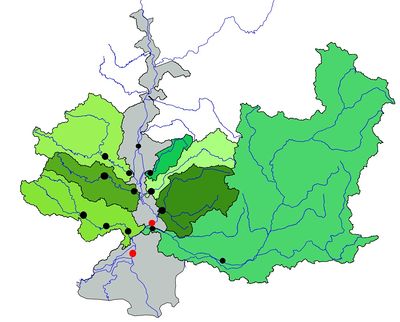
The two figures illustrate the physical domain (left) and the diagram of the flood forecasting systm.
 |

|
The main watershed is composed in its upstream part by 3 different sub-basins (symbolized in green dots) which feed the hydrometrical gauging stations on the left figure. The right diagram illustrates the flood forecasting process (symbolized in red dots) at this station.
This process is as follows:
- the black dots are considered as discharge injection points (from the sub-basins) inside the model. There are noted Q01, Q02, Q03 in the diagram. These discharges are coming from real time measurement (transformation of a water level to a discharge through a rating curve)or from estimated discharge from a rain discharge model. At these 3 locations, it is possible, subject to meteorological stations or water radar chart availability, to calibrate rain-discharge models and in case of meteorological station failure, to obtain a discharge at these 3 green stations. The corresponding discharges are represented on the diagram by Q01, Q02, Q03 and Q04
- some sub-basins (in grey on the map) are of wide dimensions (100 km²) but are not equiped with hydrometrical stations. In this case, discharges are estimated with a rain-discharge model whose calibration parameters are coming from the rain-discharge relationship of the closer sub-basin calibration
- once the 3 discharges obtained, it is possible to propagate them along the three branches in a series of cells with a constant time step reaching the confluence of the three reaches, which give the Qpi discharges which are added to the tributary discharges Qbvi1, Qbvi2 and Qbvi3 and the sum is propagated to the flood forecasting station located by a red dot
- the final estimated discharge is the sum of this propagated discharge and intermediate discharges Qbvi4, which give the final discharge at the flood forecasting station
Example n°2 : coupling discharge-discharge models
 |

|
At wider scale, when the forecasting stations cover a basin of several thousands km², it is necessary to use and stack discharge-discharge models.
Keeping the same codification than example 1, the following example represents a river whose main stream is connected to 7 wide area sub-basins (from 1000 km² to 20 000 km²). Upstream of the main river stretch, is injected a discharge Q0.
In order to obtain the maximum anticipation at the downstream stations (equal to T time propagation between Q0 and Qp2), we must balance the different branches, ie to try to offer the main “apparent” propagation time for each of them. For this purpose, we have different methods:
- The model called “persistence” is used when the hydrological dynamic is low, compared to other basins in the neighborhood or when there is no calibrated model (this is the case for Q2, Q4 and Q5). For example at station Q2, time T0, a series of discharges is injected between T0 and T0+T or Q2(T0)=Q2(T1)=...=Q2(T0+T)
- the discharge-discharge models are stacked, going to upstream station, which is the case for Q1, Q4, Q5, Q6 and Q7. The more the tributary is located near a forecasting station, the more we should go upstream in this tributary. For example, for branch Q7, we will choose the 3rd point of injection from the confluence. We also stack successively 2 rain-discharge / discharge-discharge(as presented in example 1) between Q7 and Q7” which will be coupled to the main discharge – discharge. If we choose Q7” as the injection point, the forecast at the point Qp2 should be reduce the more if the branch Q7 mainly contribute to the main stream.
We also could have intermediate injection points : here Qp1
Some advice on the use of these models
The choice, the installation and the use in operational conditions of these tools should be preceded by the installation of a hydrometric gauging station network, appropriated to each sub-basin. This network should be composed of various measuring device types (liminimeter, pressure sensor, radars, image analysis...) adapted to each site, supported by an efficient transmission network.
The modeling tools should be:
- adapted to the hydrological or hydraulic dynamic of the corresponding sub-basin
- interfaced with real time supplied data from the field
- interfaced with meteorological real time supplied measures or forecasts : rain, snow, wind...
- interfaced with other upstream or lateral hydrological or hydraulic models
- used in deteriorated conditions
- used inside their conditions of use, which must be well assimilated by flood forecasters
- confronted with the real conditions in flood situations: inundated areas, broken works...
- completed with other types of models
- as robust as possible to avoid any crash during crisis situations
- should have been calibrated on the most wide historical flooding event panel
- associated with human machine interface in order to minimize data exploitation time and to give the best realistic representation of the hydrological response for the decision makers
These simulation tools are in fact one of the components of a global architecture of a flood forecasting system. They should be based on the human strengths and abilities of the flood forecasters teams and a first rate hydrometric gauging stations network.
Note : d'autres personnes peuvent avoir contribué au contenu de cet article, [Consultez l'historique]. |
 S'abonner à un flux RSS

